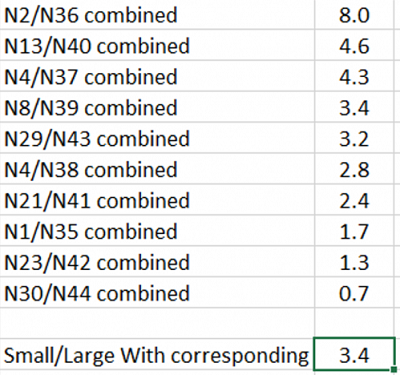
Joe Gonsowski theorized that with 34 small Allen & Ginter sets, 24 of which don’t have a corresponding large format set, the 10x number on graded small cards to large was somewhat skewed. When looking at small sets with corresponding large format sets, the smaller ratio was, of course, correct. The number wound up at 3.4 to 1 on those 10 small sets v. 10 large corresponding sets. You can see below.
The individual sets are interesting though…..there are 8x more N2’s graded than N36’s which I figured would be lower. On the other hand, there are more N44 World’s Decoration large format graded than N30 small format for a ratio of 0.7 to 1; the only one with a sub-1 ratio.
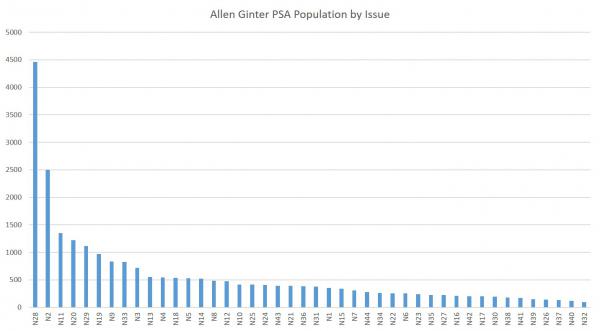
I also did a ranking by total PSA population by issue, so you can see the most popular issues or most graded issues (in all grades total). No surprise but N28 is far and away the winner in that race with N2 a distant second. And then only three other issues with more than 1000 graded for N11, N20 and N29.
Sorry the above chart is so tough to see. I have attempted to review the SGC population report but it is WAY tougher to work with than the PSA pop report. SGC is in the process of updating their website and I’ll revisit the population report when that update is complete. When I can get good data from SGC, I will present than and then a combined report for both PSA and SGC.


